


Results 1 to 10 of 47
Hybrid View


-
8th Dec 2011, 04:59 PM#1


 Respected Member
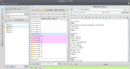
use top -c to get a better understanding.
top alone looks like:
here a is a tutorial for sites under attacklast pid: 25384; load avg: 1.06, 1.04, 0.76; up 351+06:30:24 00:10:08 139 processes: 2 running, 136 sleeping, 1 zombie
CPU states: 93.5% user, 0.0% nice, 6.3% system, 0.0% idle, 0.2% iowait
Kernel: 8 newproc
Memory: 5149M used, 2965M free, 303M buffers, 1341M cached
Swap: 6840K used, 1986M free, 1844K cached
PID USERNAME THR PRI NICE SIZE RES STATE TIME CPU COMMAND
25174 root 1 25 0 4256K 716K run 0:24 99.59% egrep
14120 www 1 15 0 127M 110M sleep 0:08 8.00% mongrel_rails
10243 root 1 15 0 48M 45M sleep 46.1H 3.60% ruby
8880 www 1 15 0 146M 131M sleep 0:12 1.80% mongrel_rails
18157 www 1 15 0 155M 140M sleep 0:21 0.60% mongrel_rails
These are few steps to be taken when you feel that the server is under attack:
--------------------------------------------------------------------------------
-
Step 1: Check the load using the command "w".
Step 2: Check which service is utilizing maximum CPU by "nice top".
Step 3: Check which IP address is taking maximum connection using the command:
netstat -anpl|grep :80|awk {'print $5'}|cut -d":" -f1|sort|uniq -c|sort -n
netstat -an|awk '/tcp/ {print $6}'|sort|uniq -c
Step 4: Check the IP address of the server having maximum connection using the
command:
netstat -alpn | grep :80 | awk '{print $4}' | cut -d: -f1 |sort |uniq -c
Step 5: Then block the IP address using APF firewall "apf -d <IP address>" or
using CSF firewall "csf -d <IP address>
--------------------------------------------------------------------------------
-
In future, to avoid DDoS attack or to lower its intensity you can install the
following modules.
============
*Mod_security: Since DDoS often targets HTTP (port 80), it is a good idea to
have a filtering system for Apache. 'Mod_security' will analyze requests before
passing them to the web server.
*Mod_dosevasive: This is an Apache module which performs 'evasive' action in the
event of an HTTP DDoS attack or brute force attack.
*(D)DoS Deflate: This is a shell script which assists in combating denial of
service attacks.
============
Please go through the following URLs for more information on how to install
"mod_security", "mod_evasive" and "dos_deflate" on your server:
-------------------
http://prasadnaik15.wordpress.com/ho...t-ddos-attack/
-------------------
http://www.eth0.us/mod_evasive
-------------------
http://forum.whmdestek.com/security/...tallation.html
-------------------
You can also enable Sysctl protection against DDoS. Please go through the
following URL for more information in this regard:
----------
http://forums.softlayer.com/showthread.php?t=304 [use your portal
username/password to login]
As mentioned by others, having some connections in TIME_WAIT is a normal part of the TCP connection. You can see the interval by examining /proc/sys/net/ipv4/tcp_fin_timeout:
[root@host ~]# cat /proc/sys/net/ipv4/tcp_fin_timeout
60
And change it by modifying that value:
[root@dev admin]# echo 30 > /proc/sys/net/ipv4/tcp_fin_timeout
Or permanently by adding it to /etc/sysctl.conf
net.ipv4.tcp_fin_timeout=30
Also, if you don't use the RPC service or NFS, you can just turn it off:
/etc/init.d/nfsd stop
And turn it off completely
chkconfig nfsd offLock Down Reviewed by Lock Down on . [cpuwatchcheck] Cpu/Server Overload Hi guys, Since one month ago that I'm receiving many emails with notifications from my server about CPU overload. Can please someone tell me how can I detect the account or issue that is causing this overload? I use WHM and also have access via SSH. This is a copy of the last email: IMPORTANT: Do not ignore this email. *This is cPanel cpuwatch on server.enigmahost.org! *While processing, the cpu has been Rating: 5

 Register To Reply
Sponsored Links
Thread Information
Users Browsing this Thread
There are currently 1 users browsing this thread. (0 members and 1 guests)
Similar Threads
-
Wordpress DB making overload on VPS
By cvrle77 in forum Technical Help Desk SupportReplies: 43Last Post: 12th May 2012, 03:59 AM -
EU Investigates Internet's Overload
By Ladybbird1 in forum News & Current EventsReplies: 0Last Post: 12th Apr 2012, 03:11 PM -
share OVH server with i7, 24gb ram, 2tb hard drive / windows server / 1 gigabit link
By tonhaum in forum Hosting DiscussionReplies: 6Last Post: 11th Dec 2011, 08:40 AM -
Please help - Server overload
By 3xupdate in forum Technical Help Desk SupportReplies: 17Last Post: 18th Oct 2011, 04:53 PM -
[Hiring] IT Expert to fix server overload
By krisuu in forum Completed TransactionsReplies: 6Last Post: 10th Jun 2011, 04:18 AM


 Staff Online
themaCreator - create posts from...
Version 3.53 released. Open older version (or...